USA / Canada 866-503-1471
International +972-722-405-222
ALM Performance: Continuously Monitor Performance and Vitality of your Jenkins Deployment
Do you want to be notified about problems in Jenkins as they happen?
Do you lack the full vitality picture of your Jenkins resources and IT infrastructures?
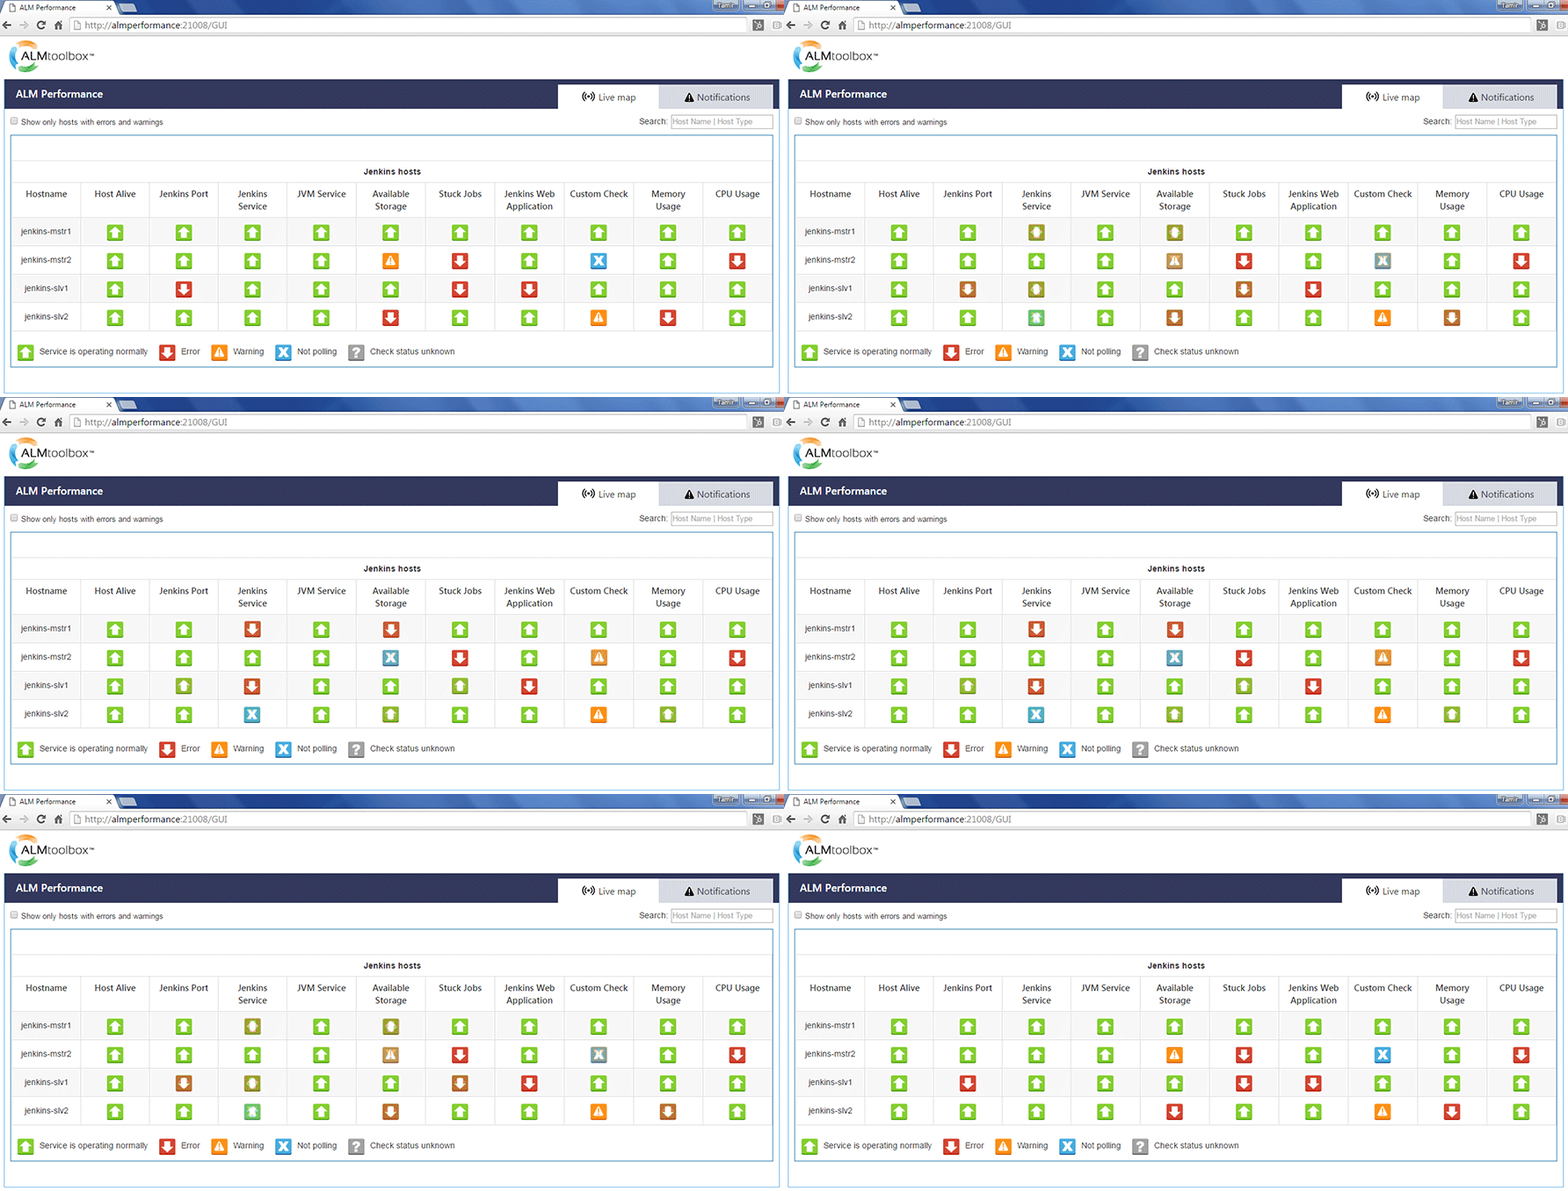
Now you can watch your Jenkins resources and related IT infrastructure resources in one dashboard, as well as get real-time email alerts. ALM Performance monitors many of your Jenkins components and IT infrastructure resources and alerts you when a service or component has stopped functioning, giving you key information and helping you get a root cause analysis immediately.
You can also request a demo webcast (at no charge).
Email us at apm@almtoolbox.com and specify a time-slot you're available, and we'll get back to you shortly.
Benefits
- Get alerts as soon as they happen
- Be the first to know about any problems
- Save time and effort of searching for the root cause reasons
- Speed up your Jenkins jobs (and CI/CD cycles)
- Monitor your Jenkins deployment 24/7
- Gain control on the tools you work with
- A lightweight and modern solution
- Set up this tool within an hour!
- Efficient data filtering that allows users to narrow down displayed data and focus on the hosts that need attention
- Seamlessly integrated with your Jenkins deployment
- Built by certified Jenkins experts and IT Infrastructure experts
- Watch the status from any devices, including your mobile!
- Agentless and secured architecture
- A scalable tool that enables you to monitor any number of hosts
- Apply the best practices of DevOps and deliver faster!
Features
| Feature \ Product Edition | Free Community Edition | Pro Edition | ||
|---|---|---|---|---|
| Continuous Checks | ||||
| Host alive Check [?] | ||||
| Jenkins Service \ Process Check [?] | ||||
| JVM Service Check [?] | ||||
| Available Storage Check [?] | ||||
| Jenkins Port Check [?] | ||||
| Stuck Jenkins Jobs and dependencies Check [?] | ||||
| Memory Usage Check [?] | ||||
| CPU Usage Check [?] | ||||
| Jenkins Web Application Check [?] | - | |||
| Custom Check [?] | - | |||
| User Interface | ||||
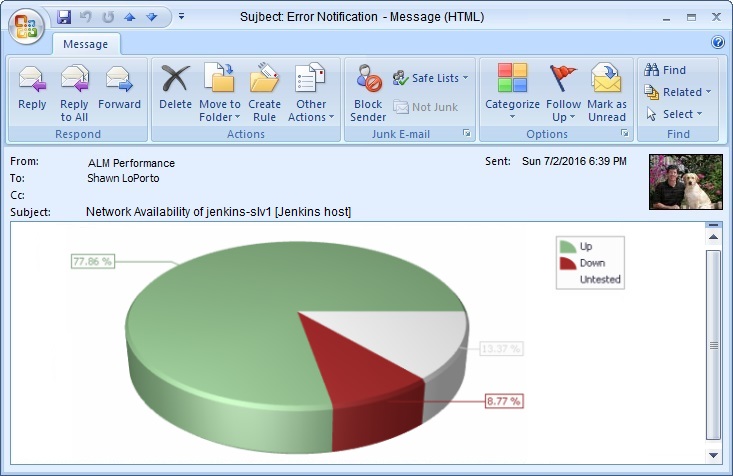
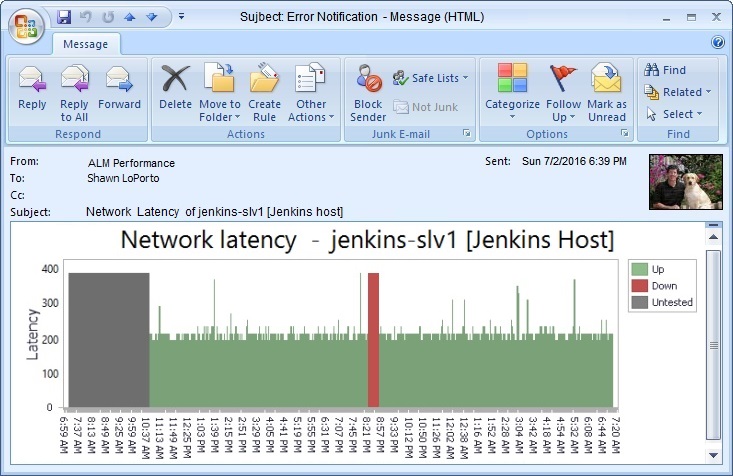
| Email alerting [?] | ||||
| Graphic Status Dashboard [?] | ||||
| Filtering [?] | ||||
| Notifications [?] | ||||
| Settings & Customization | ||||
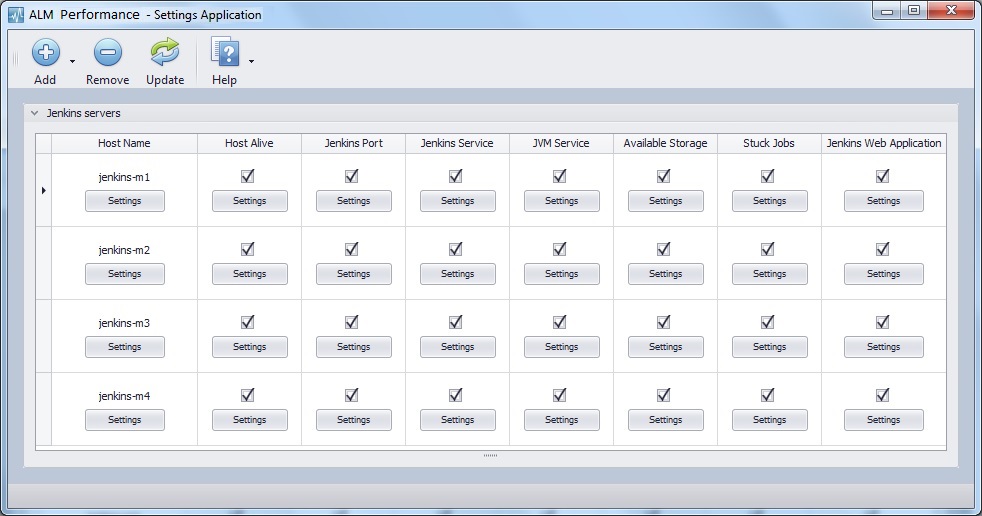
| Settings Application utility | ||||
| Supported Operating Systems | Windows, Linux, Mac OS, UNIX | Windows, Linux, Mac OS, UNIX | ||
| Supporting Jenkins Masters and Slaves | ||||
| Number of monitored hosts | Unlimited | Unlimited | ||
| Adjust Polling Frequency | - | |||
| Adjust Monitoring Hours | - | |||
| Deployment | ||||
| On-premise | ||||
| Cloud [?] | ||||
| Supporting secured SSH V2 and V1 | ||||
| Supporting LDAP authentication | ||||
| Status Charts | ||||
| Availability Pie Chart (last 24 hours) | ||||
| Latency Bar Chart (last 24 hours) | - | |||
| Support | ||||
| Get Updates | ||||
| Email Support | 30 days only | |||
| Phone Support | 30 days only | |||
| Sharing desktop Support (private webcast) | 30 days only | |||
| Available licenses | Free | Subscription or perpetual
Starting at USD 115 / month per host Get a Quote |
||
Overview Video
Watch the following 4 min. video (introducing ALM Performance tool):How It Works
Click the schema to enlarge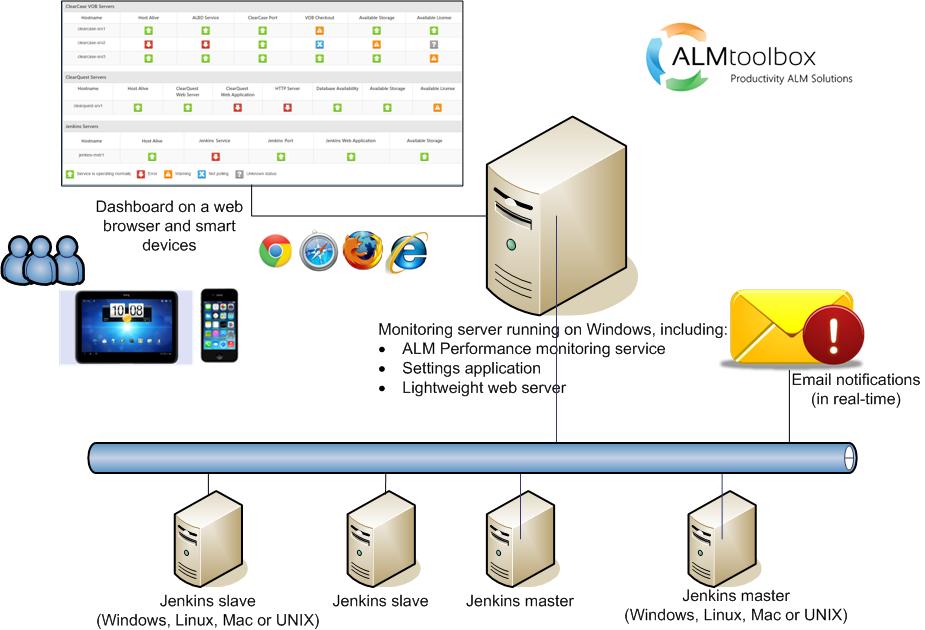
-
ALM Performance consists of 3 main components:
- Settings application - this is the configuration tool for the ALM Performance, allows you to add or delete monitored servers and configure the server’s checks and parameters
- Graphical component - this is the graphical dashboard of the system.
- Monitoring service - this is the heart the system. the monitoring service is the component that schedules, runs checks and analyzes the result.
ALM Performance can monitor all Linux, UNIX, Mac OS and windows versions and it does so in a non-intrusive and secure manner, using advanced SSH protocol. ALM Performance is installed on a Windows host and can be run on-premise or it can be run as a cloud service where we run and manage the system while it remotely monitors your servers.
What's New (Change Log)
- V1.6.1 (07/12/2016): This release contains some improvements we made after we collected feedback from our users. Click to Learn more.
- V1.6 (06/16/2016): In this release we introduced new Free Community and Pro Editions; new availability charts and enhanced configuration process. Click to Learn more.
- V1.5 (05/05/2016): This new version improves the tool and extends the monitoring capabilities, name changed to ALM Performance. Click to Learn more.
- V1.4 (03/29/2016): In this release we’re focused on some enhancements based on requests from our veteran users, including support for Oracle database; UI improvements and email alert improvements. Click to Learn more.
- V1.2 (02/11/2016): We enhanced the monitoring over Jenkins, added stuck jobs check. Click to Learn more.
- V1.1 (01/19/2016): We enhanced the email support with SMTP and email settings, enhanced the end-user dashboard and user experience, enhanced the look and feel of the ALM Performance configuration tool. Click to Learn more.
- V1.0 (12/25/2015): We launched our performance monitoring tool for Jenkins, ClearCase and ClearQuest!
Testimonials
This solution will serve our customers very well!"
 Howie Bernstein, Product Manager (2012-2015) - ClearCase, ClearQuest and Jazz Integrations, IBM Rational IBM Rational Software
It looks promising and I urge every Jenkins administrator to keep a close eye on this product"
 Yossi Zinger, SCM leader, Algotec
Monitoring Jenkins and getting email alerts is very important whenever Jenkins is a critical part of your development supply chain, and this tool is very useful for that purpose"
 Henrik Koren, DevOps leader, EMC XtremeIO
Agile ALM and DevOps requires excellent tooling and ALM Performance raises the bar in monitoring Jenkins, ClearCase and ClearQuest which are essential to creating the deployment pipeline"
 Bob Aiello, DevOps expert and author of "Configuration Management Best Practices"
