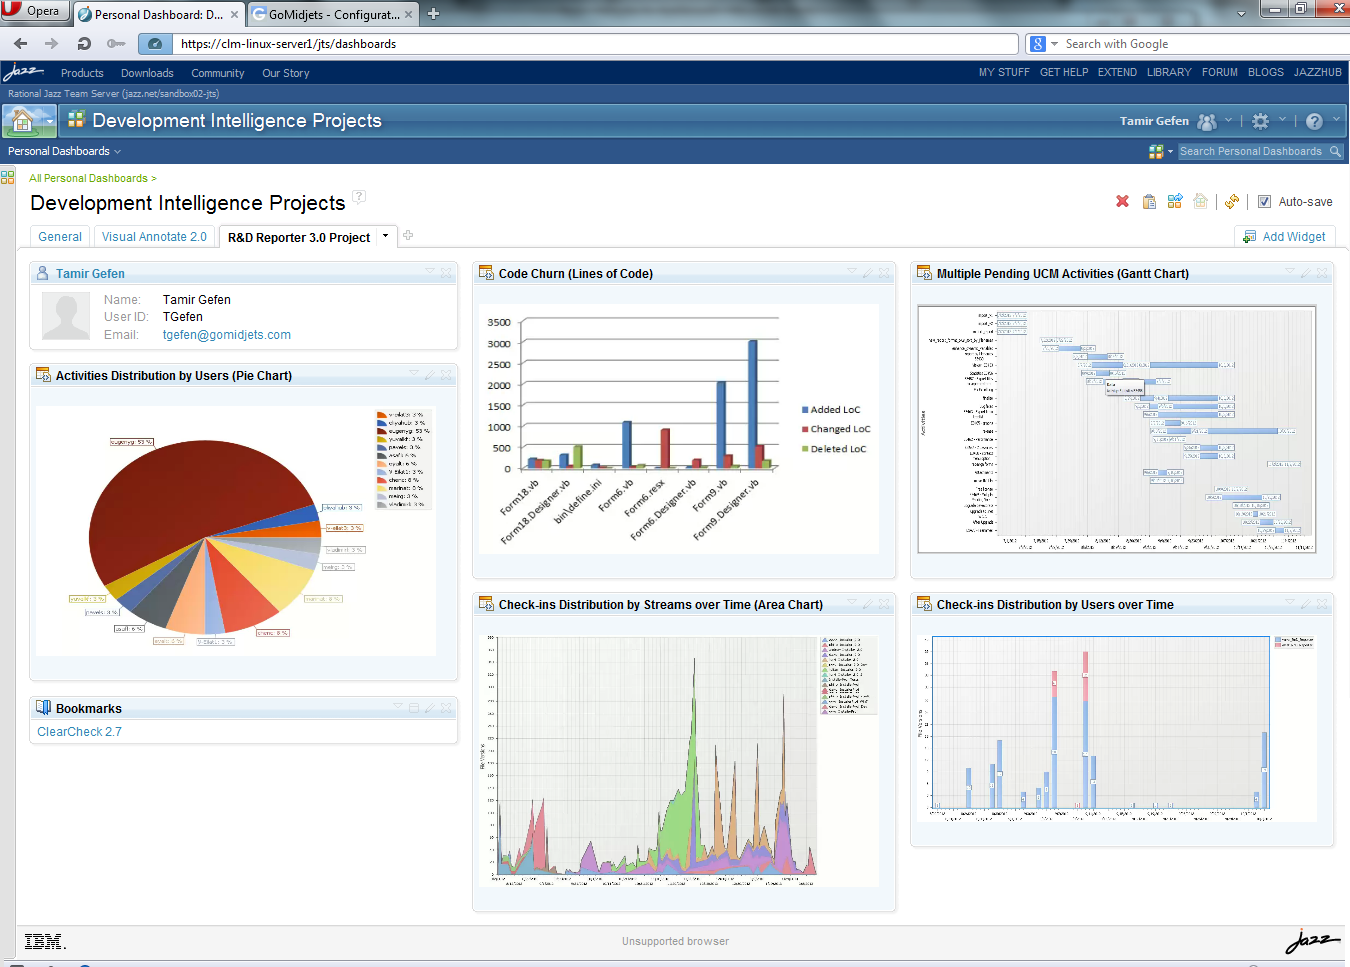
We are happy to announce a new functionality that enables you to utilize the dashboard capabilities of Rational Team Concert (RTC) and produce web-based status reports and charts for ClearCase.
These charts are part of our Development Intelligence solution for ClearCase, and they are generated by R&D Reporter, our add-on tool for real-time status reports (https://www.almtoolbox.com/rnd). Now, you can also view them through the RTC dashboard that can be downloaded (for free) from the IBM website.
This dashboard is dynamic and flexible. You can customize it to your needs and align it to your organization’s processes and roles. In the dashboard demonstrated below, we built several frames (“widgets”), each of which represents a useful graph of information retrieved from ClearCase:
- Distribution of development tasks (activities) by the names of the developers (pie chart)
- Distribution of check-ins according to UCM streams and by the names of users, over time
- Gantt chart that consolidates all pending activities from all streams in the project (which have not yet been delivered to integration stream)
- Code churn (Lines of Code) – a bar chart that shows how many code lines were inserted, removed or changed in a release.
These charts are made automatically and can be triggered from within ClearCase. There are many other charts you can generate with R&D Reporter.
To get further details, contact info@almtoolbox.com


