We are happy to announce the new release of ALM Performance v1.6, our monitoring and alerting tool for Jenkins, ClearCase, ClearQuest.
Since the release of the previous release (v1.5) a month ago, we have received and incorporated feedback from many of our users and we have tried to address all of needs with this latest version.
This tool was built especially for ClearCase, Jenkins and ClearQuest users and administrators. We have incorporated our knowledge in a very unique way so you don’t have to waste time learning how to monitor these tools or be a monitoring or ITSM expert. Users can set up this tool within an hour!
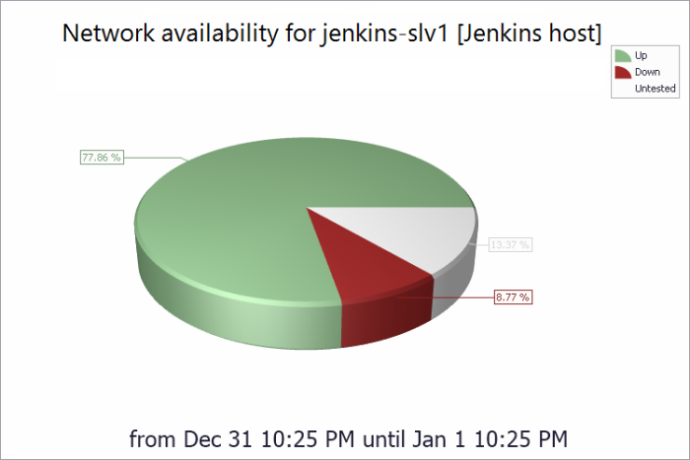
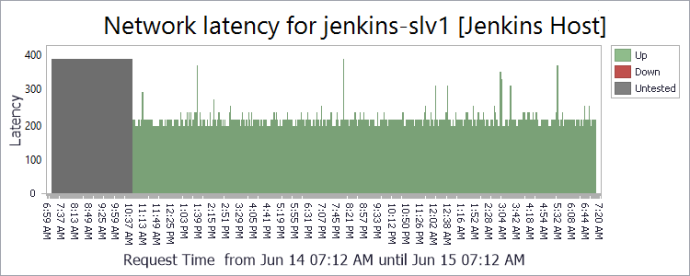
In this new version 1.6, we improved the user interface, so adjusting the tool for your needs is now easier than ever. We also provide new availability charts so you can see how your servers and hosts have functioned over the last 24 hours (every day)
We’ve also decided to provide a new Free Community Edition! We decided to contribute this edition to the community, in order to make the data (stored in Jenkins, ClearCase or ClearQuest) more accessible and help users and administrators to monitor their systems and get greater control. We believe that monitoring and alerting capabilities are crucial, and we want to ensure that everyone can enjoy these tools and get access to our knowledge on how to do it right.
Download Free Community Edition
Note: You can download the Free Community Edition, and then contact our support team (support@almtoolbox.com) and ask to evaluate the Pro (Full) Edition for 14 days.
What is new in this version? See all the details:
- New Free Community Edition, including the following checks for each host type:
Jenkins hosts:
- Host Alive
- Jenkins Service
- JVM Service
- Available Storage
- Stuck Jobs
- Memory Usage
- CPU Usage
To learn more and compare Free and Pro (Full) editions for Jenkins monitoring, click here.
ClearCase:
- Host Alive
- ALBD Service
- ClearCase Port
- Available Storage
- VOB Checkout
- Memory Usage
- CPU Usage
ClearQuest:
- Host Alive
- ClearQuest Web Server
- Available Storage
- Memory Usage
- CPU Usage
To learn more and compare Free and Pro (Full) editions, click here.
- New Availability and network latency charts. We added two charts to the ALM Performance:
- Host availability Pie Chart of the past 24 hours:

- Network latency bar chart of the past 24 hours

- Host availability Pie Chart of the past 24 hours:
Charts are generated automatically and sent by email!
You can configure how many times a week you wish to get the charts and at what time, and also set a mailing list (which can be a different emails list than the notification emails list) that will receive the report charts.
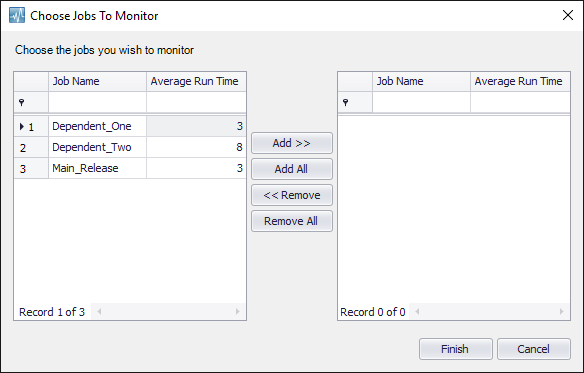
- New for Jenkins users: new management screen that helps you manage the Jenkins jobs you plan to monitor and detect if they are stuck. This new feature automatically fetches your job list and the jobs average running time from within Jenkins itself, so you don’t have to manually enter jobs’ names anymore.

- Improved Help menu, including access to the user’s guide and technical manual, as well as providing more information about the software.
- We found and fixed known issues in the Settings Application validators and in the sorting capabilities of the tool’s dashboard, so now you can enjoy a smoother host configuration process and enjoy a better dashboard.
Download Free Community Edition
Note: You can download the Free Community Edition, and then contact our support team (support@almtoolbox.com) and ask to evaluate the Pro (Full) Edition for 14 days.
To learn more about ALM Performance for Jenkins, click here to browse to the relevant webpage.
To learn more about ALM Performance for ClearCase \ClearQuest, click here to browse to the relevant webpage.
To evaluate the Pro (Full) Edition, contact our support team at support@almtoolbox.com
To get a quote, contact apm@almtoolbox.com


