New Year is a great time to summarize the past year! So let’s see what happened with GitLab product.
This time I decided to focus on new features that were released in 2020 and to represent some interesting data and insights as charts.
As providers of DevOps and ALM solutions (and partners of GitLab company for 4+ years and using GitLab ourselves for 5+ years) we work intensively with customers using GitLab or those who are looking for solutions that can be provided by tools like GitLab.
The data we’re based on is open source and available online so we used GitLab API and GitLab CI to generate some interesting charts (and we even used GitLab runners to process some data).
The data below is based on the last 12 monthly releases, i.e. 12.7 (January 2020) to 13.7 (December 2020)
Total: 711 new features were released in that period.
The most 10 popular features created over the past year:
| Release | Feature Name | Thumbs Up | User Notes | Hearts | Available In |
| 13.05 | Group wikis | 687 | 174 | 0 | Premium |
| 13.04 | Lock the latest job artifact to prevent deletion | 359 | 204 | 0 | Core |
| 13.03 | Squash Commits Options | 314 | 138 | 0 | Core |
| 12.07 | Pipeline Resource Groups | 299 | 257 | 22 | Core |
| 13.05 | Snippets with multiple files | 288 | 71 | 0 | Core |
| 13.00 | Inherit environment variables from other jobs | 280 | 122 | 0 | Core |
| 13.00 | Versioned Snippets | 251 | 51 | 0 | Core |
| 12.08 | Automatically bring in artifacts from cross-project jobs | 217 | 76 | 0 | Premium |
| 12.09 | View history of changes to issue; merge request and epic descriptions | 204 | 230 | 0 | Starter |
| 12.09 | Group Deploy Tokens | 184 | 88 | 3 | Core |
How did we measure it?
We’ve used a sorted and weighted score of upvotes, user notes, and hearts for all new 711 issues. The 10 above are the top ten.
Notes:
- If you want to see where you can find those numbers see the following screenshot or see in an arbitrary GitLab issue here.

- If you want to see a list of all new features and scores click here.
New features by GitLab stages and categories
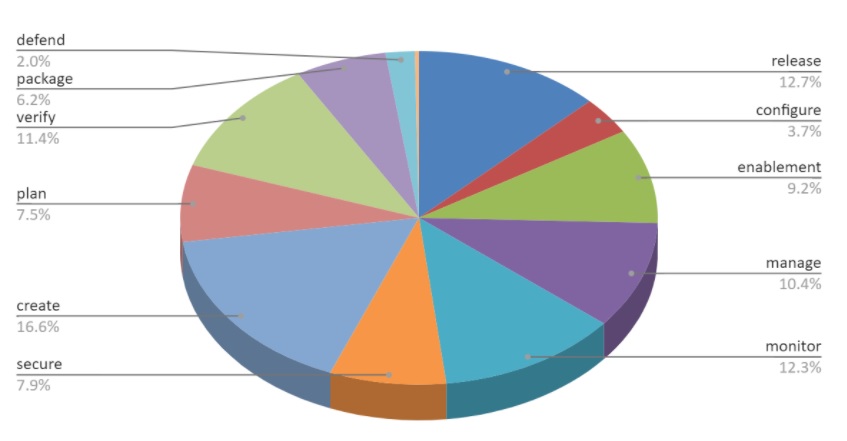
New features (created in 2020) by GitLab Stages:
Click to enlrage
This is a distribution chart. We collected all new features over the past year (12.7 -13.7) and checked what stage they belong to.
GitLab separates all features into 11 stages: Manage, Plan, Create, Verify, Package, Secure, Release, Configure, Monitor, Protect, and Enablement.
A more detailed chart demonstrating GitLab categories can be seen here:
New features by GitLab Categories:
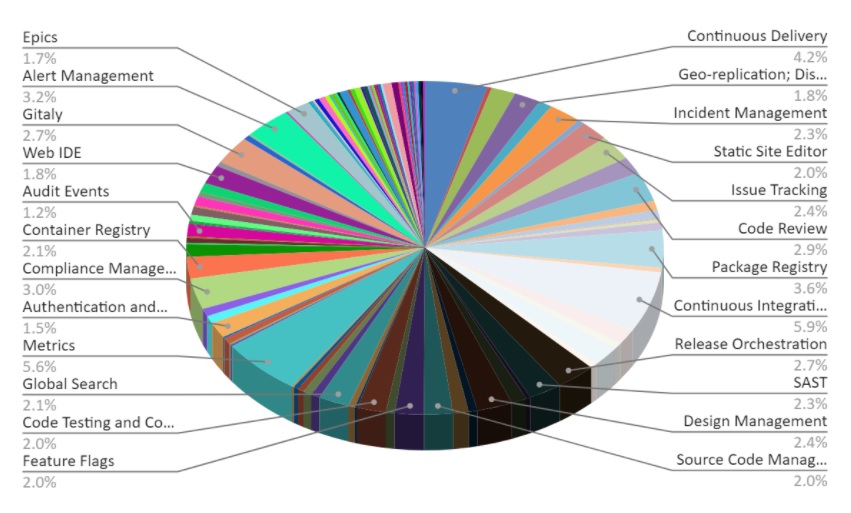 The category is a sub-branch of “Stage” (every category belongs to one stage).
The data for this chart was available starting on 12.8 only (so it’s based on releases 12.8 – 13.7).
New features by stage (every month)
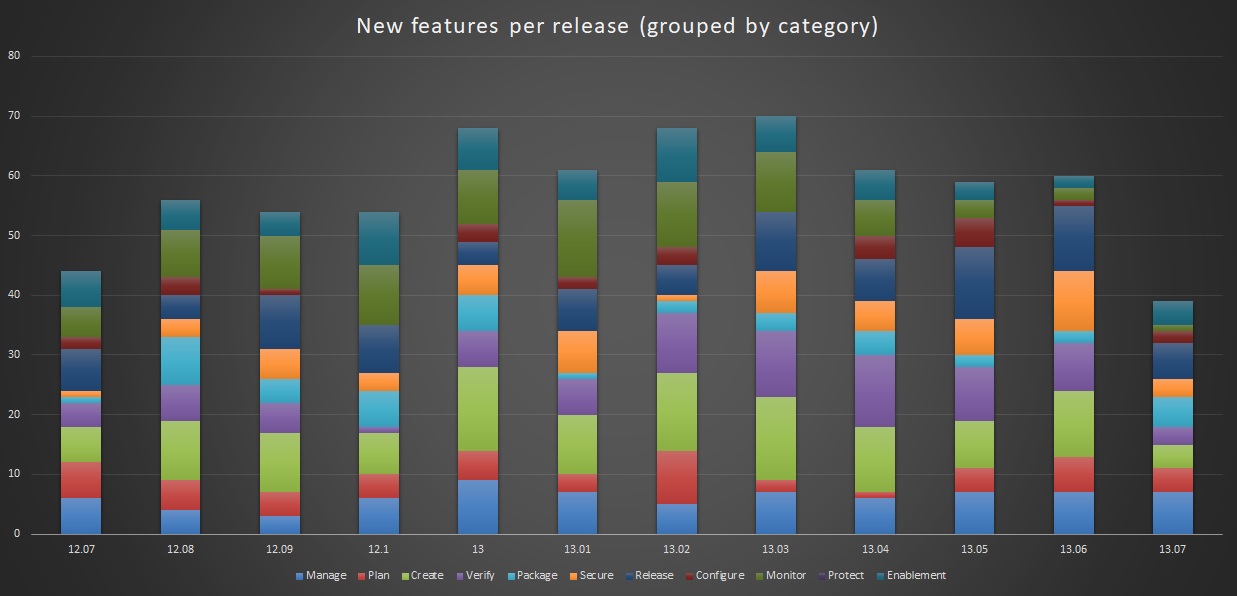
Here we share 3 charts of the same data so you can see it from 3 different perspectives.
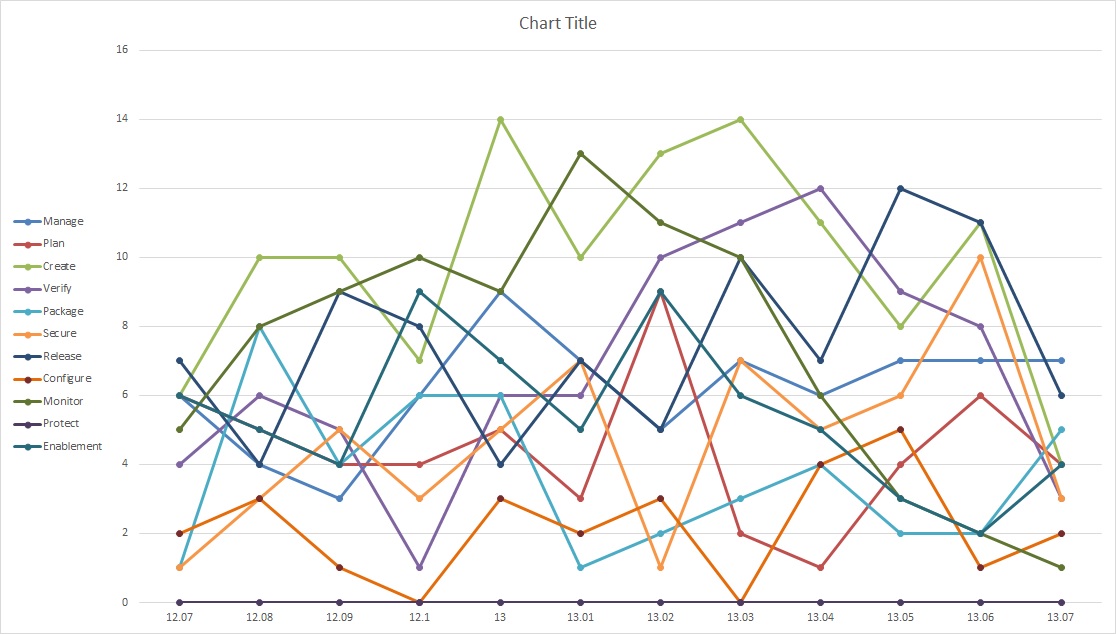
X represents the release name (12.07 to 13.07). Y represents how many new features were released. Click to enlarge
You’ll see this is actually a trend chart by GitLab stages.
This chart demonstrates some trends, yet it might seem quite messy so I created the following bar chart as well:
(click to enlarge)
Same chart but normalized to 100% :
X represents release name (12.07 to 13.07)
Y represents the proportional part of new features per category
You can see that most of the work is done in the Manage, Create, Release and Verify stages.
New Features by GitLab Editions:
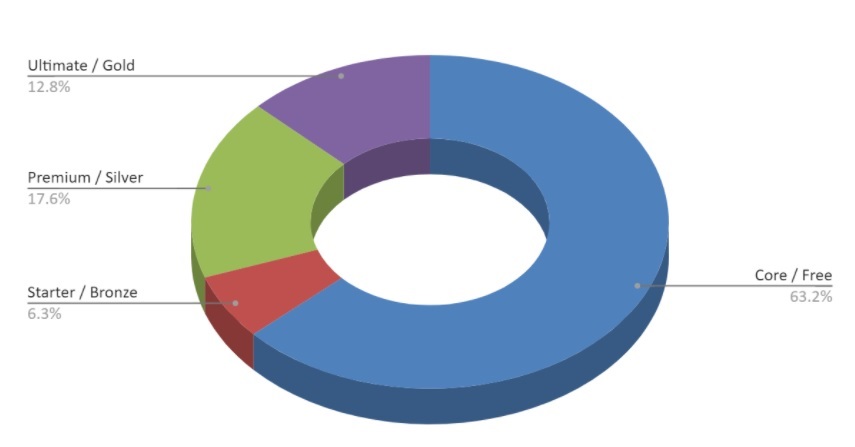
New features by edition (all editions):
There were a total of 711 new features. 63.2% were placed in free editions – 6.3% in Starter/Bronze etc.
New features by Enterprise editions only:
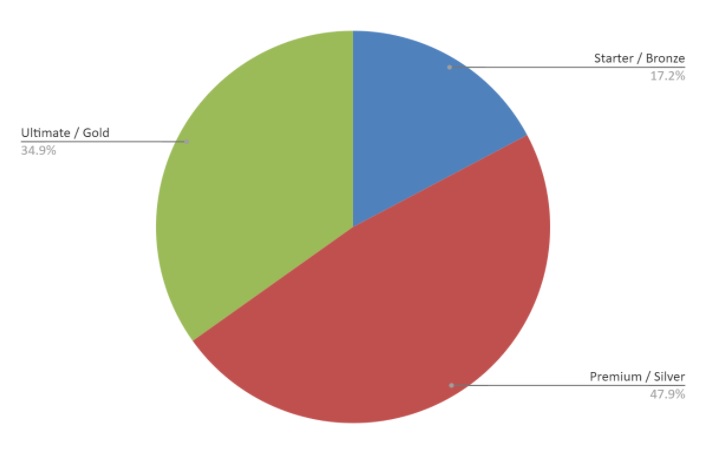
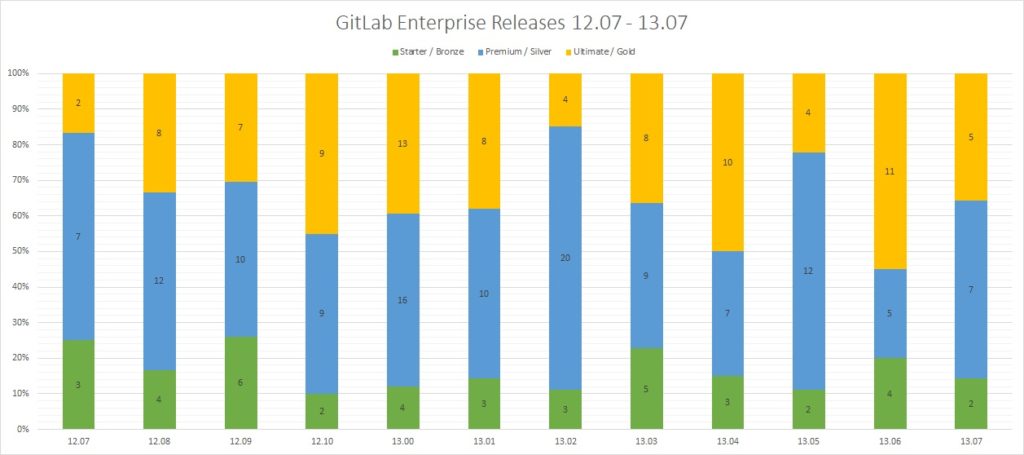
New features by Enterprise edition every month (normalized)
How many new features went to Starter, Premium, and Ultimate every month (normalized to 100%) :
X axis represents release name (12.07 to 13.07). Y represents the proportional part of new features per enterprise release (Starter/Bronze – Premium/Silver and Ultimate/Gold)
This chart does not include new features that were placed in the Core/Free edition.
Epilogue
The raw data (we based the charts on) is available here: https://about.gitlab.com/blog/archives.html (we used the original post of the major releases and the relevant code behind)
If you notice additional interesting insights share them with us (at gitlab@almtoolbox.com) and we may add it inside (and give you a credit of course)
If you want to see our data warehouse (the one we built to generate some of the sophisticated charts above) you can email us and we’ll send you a link (please mention your company name)
ALM-Toolbox is an official partner of GitLab in Europe and worldwide for 4+ years. We provide consulting, GitLab licenses, private hosting, quality and fast support, GitLab add-on development, and we support and sell a variety of DevOps and ALM tools.
We can help you take the data you have within your git / GitLab/ GitHub / Jira / Jenkins (and even ClearCase/ClearQuest etc.) and convert it into interesting insights, reports and alerts.
Contact us: gitlab@almtoolbox.com or +972-722-240-5222 / 1-866-503-147 (USA & Canada)
This post was written by Tamir Gefen, CEO of ALM-Toolbox. Much thanks to Alex Karnovsky (of our team) who helped with building the data warehouse using GitLab’s API and automation.
Final notes:
- We sometimes used 12.07 instead of 12.7 to avoid confusion (e.g. there’s a version named 12.10 which was released later than 12.7)
- The numbers in the table above are valid for January 4th (those numbers might be changed in the future)
